3 Lessons From Managing Klaviyo's Massive ClickHouse
Lessons from managing one of the world's largest ClickHouse systems at Klaviyo.
At Klaviyo, I was responsible for managing one of the world’s largest ClickHouse clusters.
The cluster consisted of hundreds of nodes, ingesting 700k events every second, processing 4k queries/second, serving 180k e-commerce companies.
And these volumes spiked significantly during holidays, especially on Black Friday.
Here are 3 lessons I learned managing Klaviyo’s massive ClickHouse cluster.
Lesson 1: Separate Compute and Data Layers
A major limitation of ClickHouse is the lack of separation between storage and compute.
This means that storage and compute cannot be scaled independently, and as a result, scaling up ClickHouse requires repartitioning data—an extremely expensive operation.
However, we managed to separate our compute and storage layers regardless, and it was one of the most impactful architectural decisions we made.
Moreover, we implemented this on our existing cluster without any repartitioning of data or downtime.
Here’s a simplified explanation of how we’ve done it.
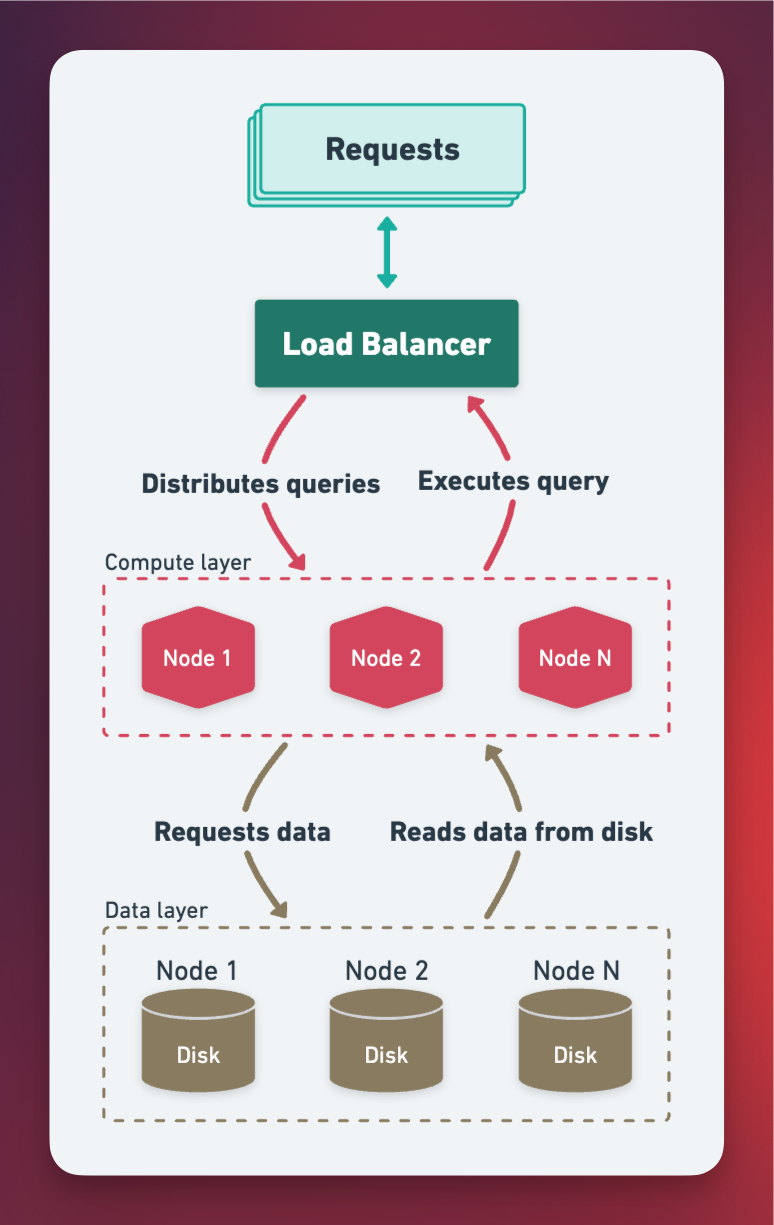
The compute layer - We spun up a new set of ClickHouse nodes consisting solely of distributed tables that don't store any data locally. This acts as our "compute layer."
The data layer - The original nodes in our cluster, which have the data on disk, act as the "data layer."
All queries are directed to the nodes in the compute layer. Since these nodes don’t have any data, they request the necessary data to execute the query from the data layer nodes, the data layer nodes read the data from disk and send it to the compute layer nodes who use the data to execute the query and return the results to the user.
This means the data layer nodes only perform read/write disk IO operations, while the compute layer nodes handle all query processing.
Since the compute layer nodes have no data they can be scaled horizontally with relative ease.
A load balancer is used to distribute queries among the compute layer nodes.
Furthermore, this setup enables multiple independently scalable compute layers—for example, one for powering user-facing dashboards and another for internal monitoring. This is achieved by sending each query to its respective compute layer (more accurately, to the load balancer of that compute layer).
Lesson 2: Distribute Events Using a Consistent Hash Ring
In multi-tenant setups, a common pattern is sharding data by customer ID.
However, this becomes problematic when a particular customer causes a massive spike in volume.
Such spikes can consume all available resources on their designated node, severely degrading performance for other customers on that node—causing a noisy neighbor effect.
This issue can significantly slow down ingestion to ClickHouse and cause TOO_MANY_PARTS errors if the ingestion rate increases.
To solve this, we distributed customer data more uniformly across nodes.
Here’s a high-level outline on how we achieved it:
We split the ClickHouse cluster into multiple virtual groups/layers (e.g., 32 virtual layers).
We created a consistent hash ring based on the number of virtual layers.
Now for each incoming event, we determine which layer it should be inserted into by concatenating its "
customer_id + event_type" columns and passing it into our hash ring function to get its corresponding layer. Then we insert the event into that layer.
The decision to concatenate the "customer_id + event_type" columns before passing it to the hash ring function helps distribute data more uniformly by inserting different event types from the same customer into different nodes.
If we were to only hash the “customer_id” then all the events for that customer would be ingested to the same nodes and cause resource contention during volume spikes.
For example, if one customer sends 10M emails for a newsletter, there will be 10M "email sent" events, 10M "email delivered" events, 3M "email opened" events, and so on.
By concatenating "customer_id + event_type," these different types of events (sent, delivered, read, etc.) are distributed across different nodes/layers, significantly alleviating resource contention and reducing the risk of noisy neighbors during volume spikes.
Lesson 3: Use Materialized Views to Optimize Queries
The rapid growth of data volume in our ClickHouse cluster began to slow down common queries, as ClickHouse had to scan increasingly large amounts of data over extended periods.
Implementing Materialized Views to incrementally aggregate data for these queries could potentially make them 10 times faster. However, since Materialized Views in ClickHouse are incremental, all existing data needed to be backfilled into the Materialized View which required a challenging backfilling strategy.
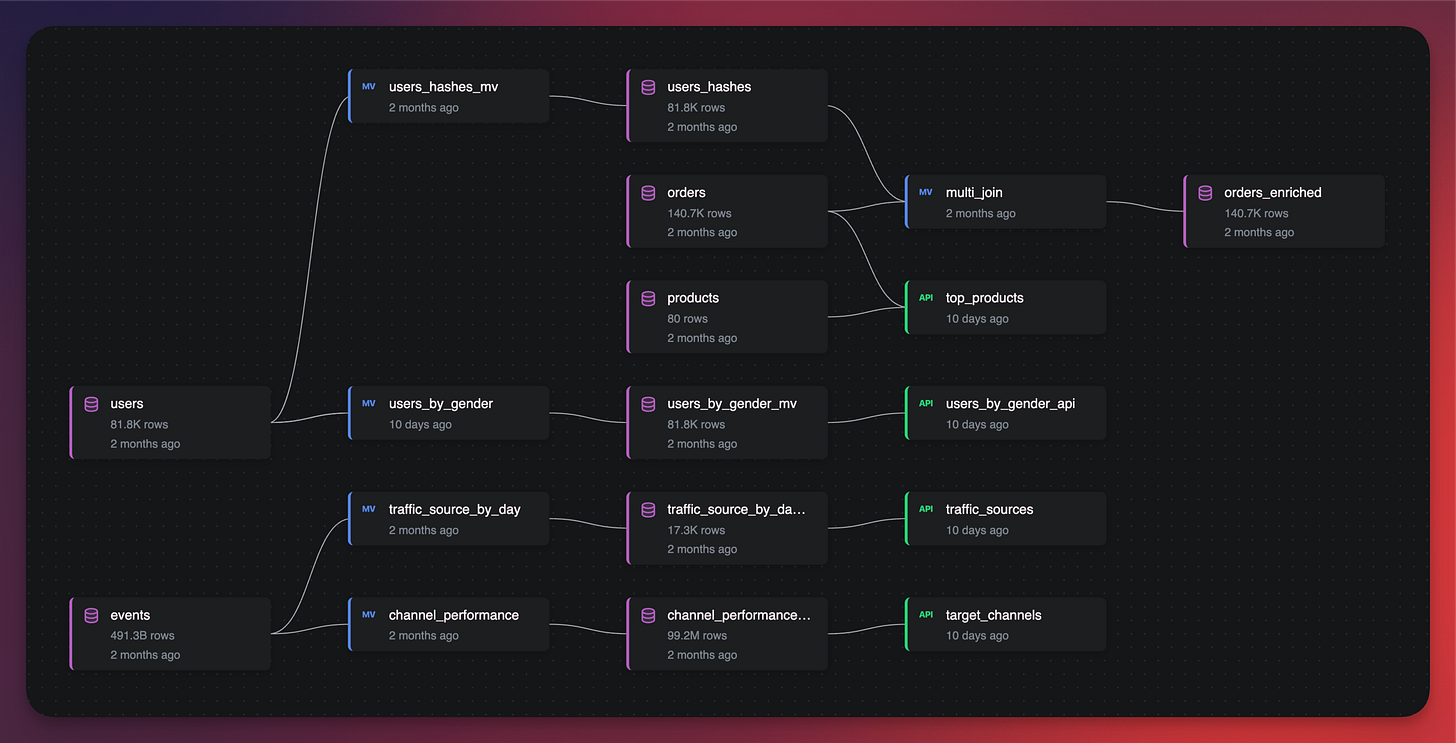
Furthermore, as more queries required optimization, the number of Materialized Views required quickly increased, some of which formed chains (MV -> MV -> MV). ClickHouse lacks a built-in method to visualize the connections between tables and views or to determine if changes would cause downstream issues. Consequently, schema migration became challenging, and development velocity decreased.
Had we addressed this issue earlier by developing the necessary tools to manage ClickHouse pipelines and automatically detect breaking changes, we could have accelerated our adoption of Materialized Views and significantly increased development speed.
We've applied this core lesson in Airfold, which now visualizes dependencies between tables and views and can detect breaking changes:
Considering using ClickHouse?
If you're considering using ClickHouse, we highly recommend using it with Airfold, it’s the go-to tool for modern data teams to run ClickHouse.
Airfold was created by the top contributors of ClickHouse who also managed the massive ClickHouse cluster at Klaviyo.
Here’s Airfold in less than 3 minutes:
And reach out to us for any questions - even if you're not using Airfold, we love helping the ClickHouse community!


